Blackouts in the Pacific: Where the Hormuz Crisis Hits Last
Pacific island nations are rationing fuel and facing daily blackouts from the Strait of Hormuz blockade. What this means for supply chain end-node risk.
Daily Blackouts, 8,000 Miles from the Strait
On April 14, Tuvalu declared a state of emergency. The Marshall Islands followed with a 90-day economic emergency declaration. Fiji -- one of the Pacific's larger, better-prepared economies -- is seeing rolling blackouts. The cause is not a local disaster. It is a blockade 8,000 miles away in the Strait of Hormuz.
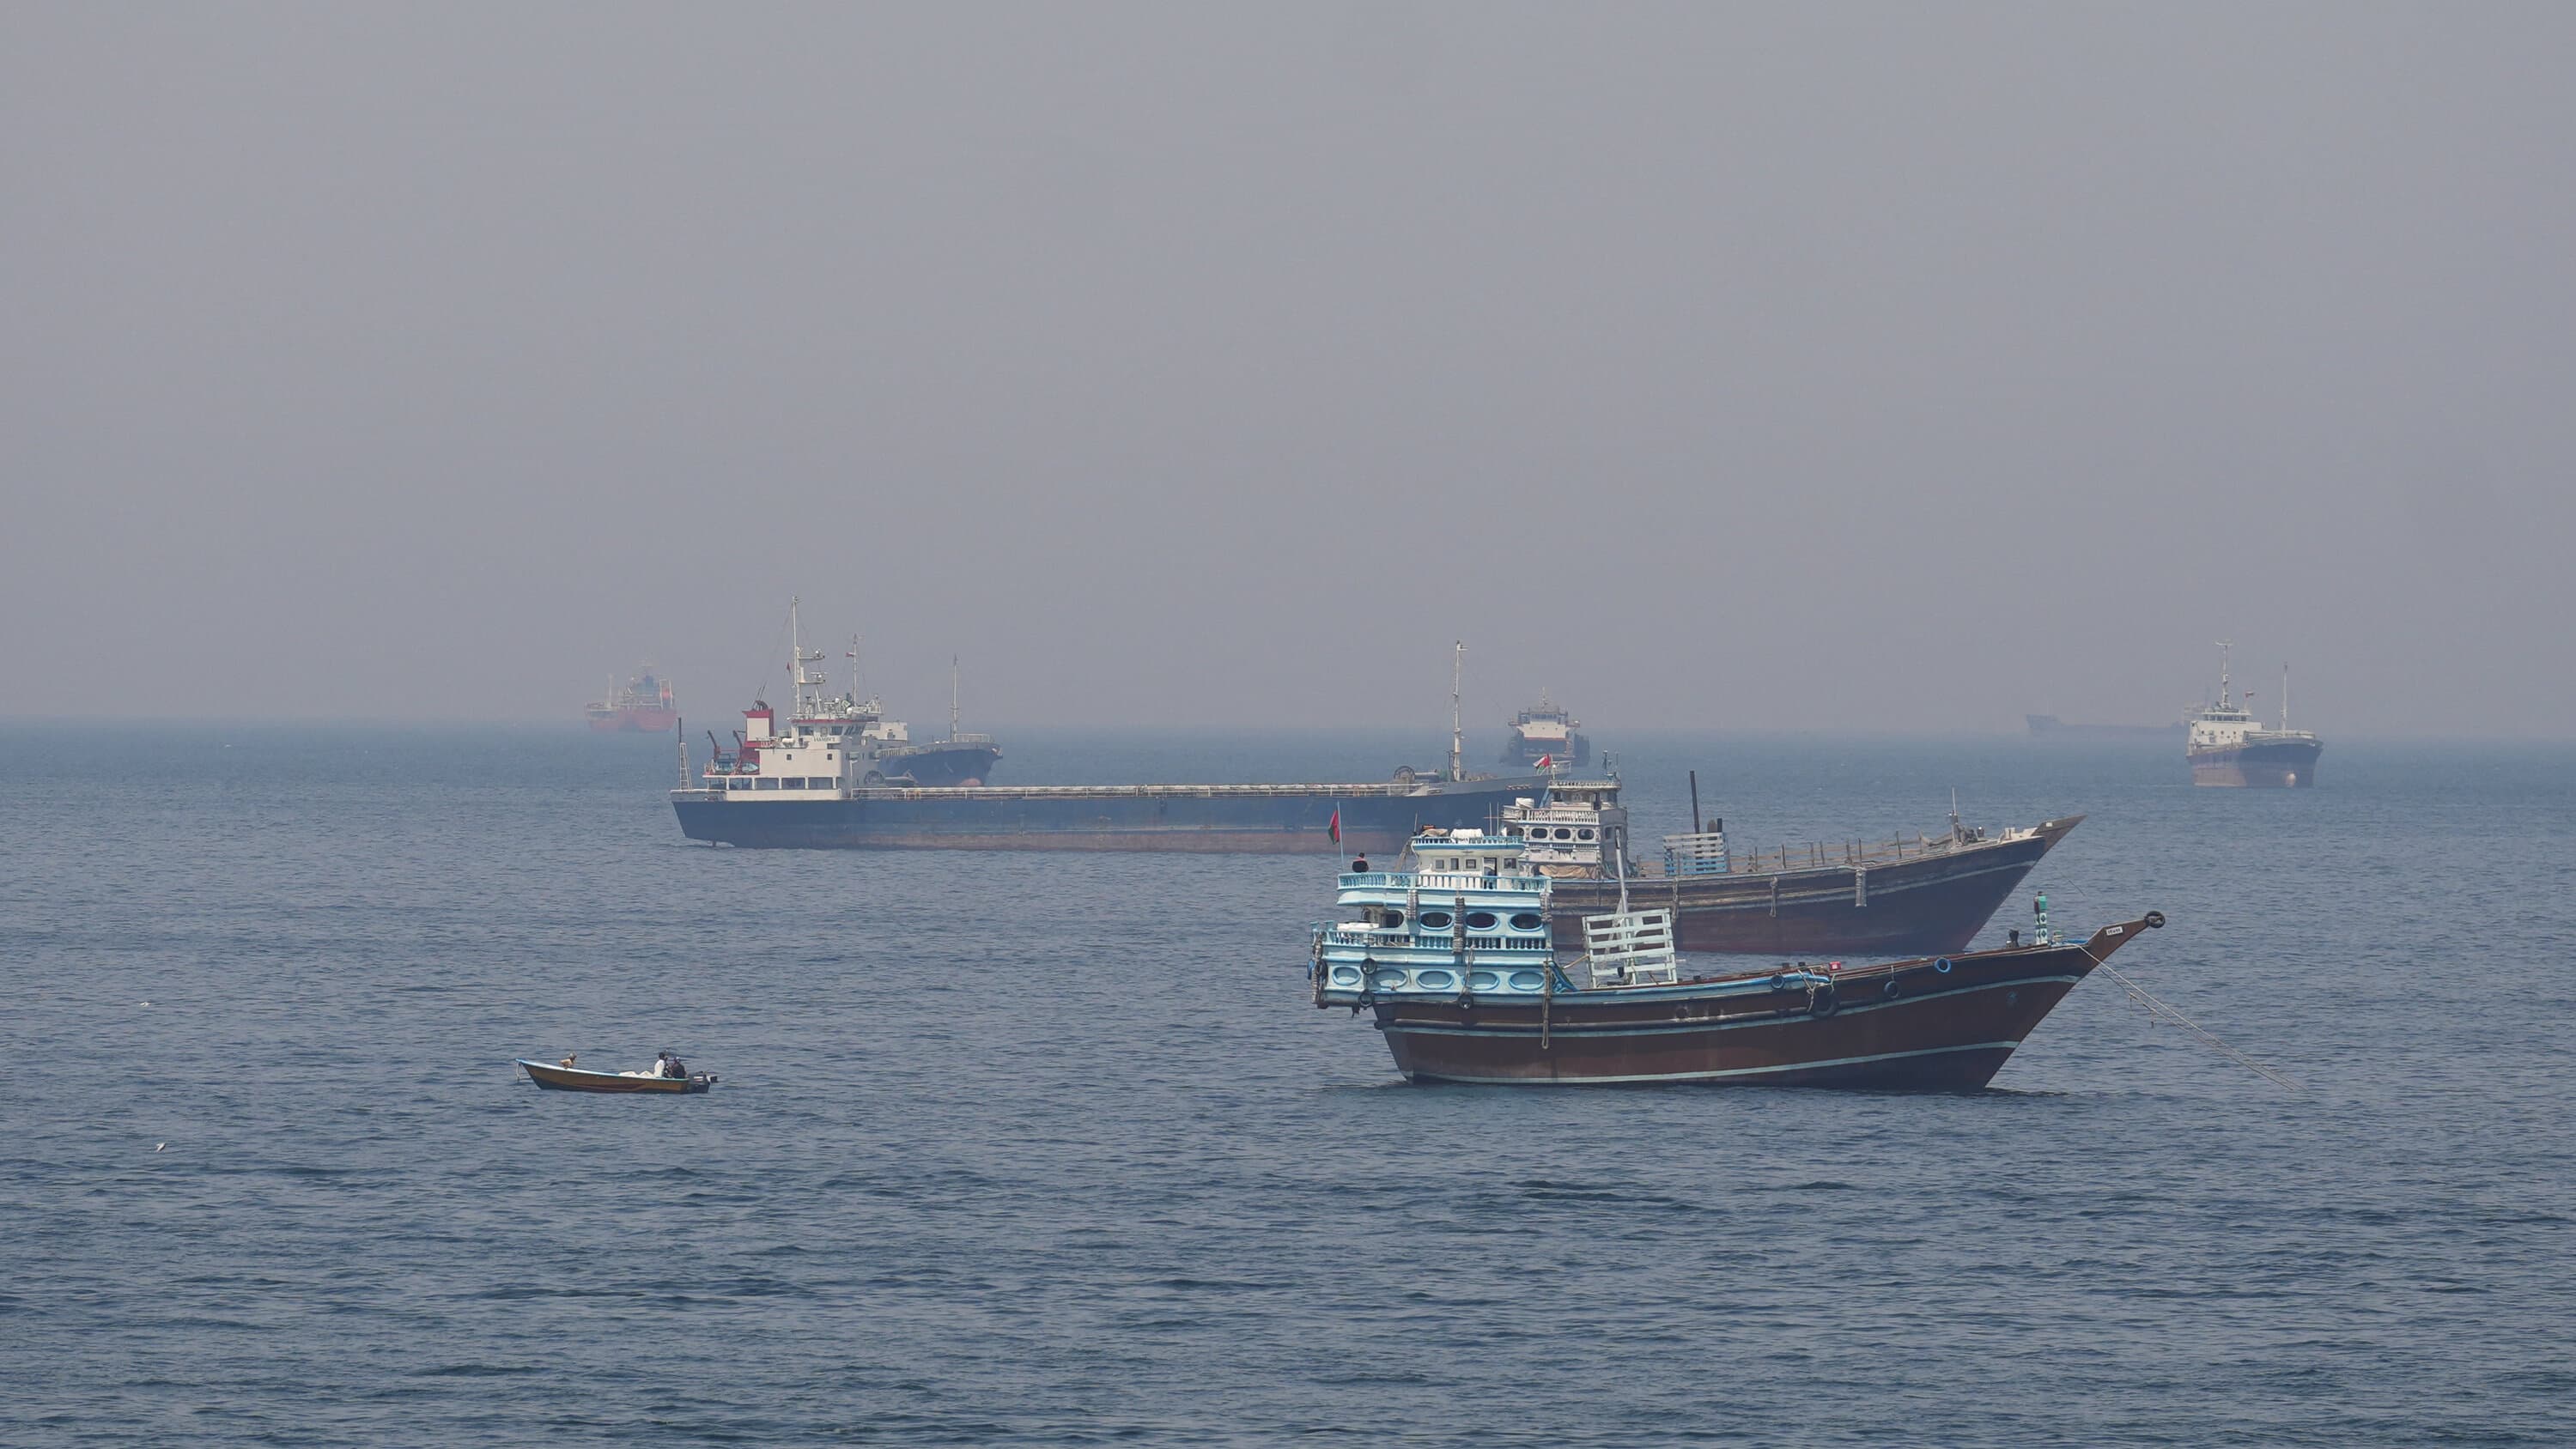
Since February 28, 2026, Iran has blocked commercial shipping through the strait, which carries 20% of global seaborne oil and 20-25% of global LNG (UN News). Traffic dropped over 90%. The immediate fallout hit energy markets and major shipping lanes. But six weeks later, the crisis is reaching the most vulnerable nodes in the global supply chain: small island states that depend almost entirely on imported diesel.
The End of the Chain
Most supply chain risk analysis focuses on chokepoints, major ports, and Tier 1 suppliers. Pacific island nations rarely make the list. But they are a textbook case of end-node fragility -- and a preview of what happens when disruption cascades far enough.
- Tuvalu gets over 90% of its energy from imported diesel. Communities are experiencing daily blackouts. The government has imposed fuel rationing (UN News).
- The Solomon Islands reported 40-50 days of fuel reserves. That buffer is shrinking as freight costs spike and resupply schedules slip (UN News).
- Vanuatu warned of electricity price increases. Palau, Nauru, and Kiribati are weighing emergency responses.
- Recent cyclones compounded the problem. Fiji and the Solomon Islands were already dealing with storm recovery when the fuel crunch hit.
Regional governments have implemented price caps and rationing. But the core problem is structural: these economies sit at the far end of Asia-Pacific shipping lanes, and the fuel and freight cost increases from the Hormuz blockade flow directly into their operating costs.
Why This Matters Beyond the Pacific
The Pacific island scenario is extreme, but the mechanism is not unique. Any operation that depends on a long, concentrated supply chain -- a single fuel source, a single shipping lane, a single port -- faces the same cascading risk. The further you sit from the disruption, the longer the delay before it hits. But when it arrives, your buffer is already gone.
Three questions for operations teams this week:
Where are your end nodes? Map the facilities, suppliers, or logistics partners that sit at the far end of your supply chain. If a chokepoint closes for six weeks, what happens to them? The answer is not always obvious -- a data center in Fiji, a distribution partner in the Marshall Islands, or a manufacturing subcontractor in the Philippines all face the same fuel exposure.
What is your fuel dependency chain? The Hormuz blockade is an energy disruption first and a shipping disruption second. If your operations depend on diesel, LNG, or petrochemical feedstocks that transit the Gulf, trace the dependency to its end. Orion tracks energy and geopolitical risk signals globally and can flag exposure to chokepoint disruptions before they cascade through your supply chain.
How fast do you detect second-order impacts? The Hormuz blockade started February 28. Pacific blackouts started in mid-April -- a six-week lag. Most risk dashboards caught the initial event. Fewer caught the downstream consequences. The gap between detection and impact is where operational losses accumulate.
Wrapping Up
The Pacific fuel crisis is a signal, not an anomaly. When a chokepoint closes, the damage travels outward until it finds the weakest link. For operations teams, the question is whether you see those links before the disruption reaches them.
See how Orion monitors these risks in real time
Get adaptive risk alerts across 190 countries, updated continuously from 100,000+ data sources.
Request a Demo →Related
CISA to Infrastructure: Plan for Going Offline
CISA's CI Fortify initiative tells critical infrastructure operators to prepare for weeks of isolated operations during cyber conflict. Here's what it means.
ArticleHurricane Season 2026: Prepare Operations Before June 1
The 2026 hurricane season starts June 1 with 11-16 storms forecast. Below-average counts don't mean low risk. Here's how operations teams should prepare now.